


Login
Get Instant Pricing On 23,000+ Aircraft

>

U.S. commercial airline fatalities by year tell a story of remarkable progress. What was once a mode of transportation with multiple deadly accidents each year has become one of the safest ways to travel. This article is for travelers, aviation enthusiasts, and anyone interested in understanding the safety record of U.S. commercial airlines. Understanding these trends helps travelers make informed decisions and appreciate the progress in aviation safety. This article breaks down the data decade by decade, highlights the accidents that shaped safety reforms, and explains what these trends mean for anyone who flies today—whether on a scheduled airline or a private charter.
U.S. commercial airline fatalities by year have fallen dramatically since the late twentieth century. Fatal accidents involving major scheduled carriers are now exceedingly rare, and several recent years have recorded zero passenger deaths aboard U.S. airlines.
The National Transportation Safety Board tracks every civil airplane accident and publishes annual aviation accident statistics, making year-by-year analysis possible.
General aviation refers to all non-scheduled, non-military civil flying, including private pilots, air taxis, and recreational aircraft. General aviation aircraft are involved in 78% of crashes in the United States, meaning most fatal events happen outside of scheduled airline operations.
Major U.S. carriers routinely record zero onboard passenger fatalities in given years—a stark contrast to the 1970s and 1980s, when hundreds died annually.
U.S. commercial airlines have experienced multiple consecutive years with very few fatalities, and statistical trends show that fatal accidents are exceedingly rare for major airlines now.
These safety gains also inform how travelers compare commercial flight options with private jet charter. Platforms like Jettly give travelers flexibility and access to vetted operators and a broad range of private charter aircraft, offering another way to manage travel risk.
"U.S. commercial airline fatalities" refers to deaths resulting from accidents involving U.S.-certificated air carriers operating under 14 CFR Part 121. This covers scheduled passenger and cargo flight operations, both domestic and international.
General aviation refers to all non-scheduled, non-military civil flying, including private pilots, air taxis, and recreational aircraft.
Data from the NTSB and FAA show a steep, sustained decline in fatal accidents from the 1970s through the 2000s. By the 2010s, multiple years passed with zero onboard fatalities for large U.S. airlines. The risk of a fatal accident in U.S. commercial aviation has fallen substantially over decades, and there has been a dramatic decline in fatal accidents for scheduled commercial air carriers.
Fatalities are counted by the date of the accident and typically separated into passengers, crew, and people killed on the ground. Data sets separate commercial operations into major scheduled airlines and general aviation, which helps analysts isolate trends for each category.
Here is a simplified comparison of approximate average annual fatalities for scheduled U.S. carriers (Part 121):
|
Decade |
Approx. Avg. Annual Fatalities |
Typical Fatal Accidents per Year |
Notable Events |
|---|---|---|---|
|
1970s |
250–500 |
5–12 |
AA Flight 191 (1979) |
|
1990s |
Tens to low hundreds |
2–6 |
TWA Flight 800 (1996) |
|
2010s |
Single-digit or zero |
0–1 |
Multiple zero-fatality years |
Key points from this data:
The 1970s saw routine multi-accident years with hundreds of deaths.
By the 1990s, average yearly fatalities dropped but isolated disasters still produced spikes.
The 2010s represent the safest era in U.S. airline history, with some years recording no aboard fatalities at all.
Flight activity (departures, passenger-miles) increased during this period, making the decline in fatality rates even more dramatic.
The National Transportation Safety Board is the independent U.S. agency responsible for investigating every civil airplane accident and publishing annual statistics. Its role is investigative, not regulatory—it identifies probable causes and issues safety recommendations.
The NTSB distinguishes between commercial air carriers (Part 121), commuter operations, on-demand air taxis (Part 135), and general aviation. This matters because lumping all categories together would obscure the safety record of scheduled airlines.
Core fields tracked in NTSB databases include:
Date and location of the accident
Operator and aircraft type
Number of fatalities (passengers, crew, ground) and serious injuries
Flight phase (takeoff, en route, landing)
Probable cause and contributing factor
The NTSB includes aircraft destroyed by sabotage or hijacked flights in fatal accident counts, which can distort certain years. The 2001 totals, for example, include both terrorism-related events and the separate crash of American Airlines Flight 587.
Travelers can review the NTSB's publicly available annual safety reviews and accident database to evaluate airline safety using official data rather than headlines.
The trajectory from the 1970s to the 2020s tells the clearest safety story in transportation history.
Multiple fatal accidents happened every year.
Aircraft collided in mid-air, mechanical failure brought down jets, and poor weather conditions contributed to crashes that killed hundreds annually.
In 1979 alone, American Airlines Flight 191 accounted for 273 fatalities—making it one of the deadliest single-year totals in U.S. aviation history.
Fatal accidents became less frequent but still occurred at a pace that kept annual totals in the tens to low hundreds.
TWA Flight 800 killed 230 people in 1996.
Improved crew training and cockpit resource management began to reduce human-error-related accidents.
The U.S. had 37 aircraft accidents since 2000 involving scheduled Part 121 carriers—a fraction of previous decades.
Colgan Air Flight 3407 in 2009 (50 fatalities) was the last major fatal passenger event before a long quiet stretch.
Many years recorded zero passenger fatalities aboard U.S. scheduled airlines.
In 2023, commercial aviation recorded the lowest fatalities ever, and the lowest accidents recorded.
The accident resulted in rates so low that the fatal accident per departure figure approached zero in multiple years.
|
Period |
Fatal Accident Trend |
Annual Fatality Range |
|---|---|---|
|
1970s–1980s |
Multiple per year |
Hundreds |
|
1990s |
2–6 per year |
Tens to low hundreds |
|
2000s |
Declining sharply |
Low tens or fewer |
|
2010s–2020s |
Often zero |
Zero to single digits |
Major U.S. carriers routinely record zero onboard passenger fatalities in given years, highlighting the significant improvement in airline safety. In 2023, commercial aviation recorded the lowest fatalities ever, with a death rate of just 0.01 deaths per 100 million miles traveled, underscoring the exceptional safety of air travel today.
Several tragic accidents have shaped aviation safety reforms. American Airlines Flight 191 crashed on May 25, 1979, resulting in 273 fatalities, making it one of the deadliest accidents in U.S. history.
Similarly, American Airlines Flight 587 crashed on November 12, 2001, killing 265 people.
Other notable accidents include TWA Flight 800, which exploded on July 17, 1996, killing 230, and Delta Air Lines Flight 191, which crashed on August 2, 1985, killing 137.
Since 2000, the U.S. has experienced 37 aircraft accidents involving commercial carriers, but fatal accident rates per flight hour have fallen about 80% between 1983–2000 and 2001–2017.
Statistical trends show that fatal accidents are now exceedingly rare for major airlines, aided by regulatory changes in the 1980s and 1990s that significantly improved aviation safety.
Data sets separate commercial operations into major scheduled airlines and general aviation, with most modern civil aviation fatalities occurring outside of major scheduled airlines.
General aviation aircraft are involved in 78% of crashes, emphasizing the higher risk in this sector compared to commercial airlines.
Current generations of commercial aircraft feature advanced safety technologies that have contributed to a dramatic decline in fatal accidents for scheduled commercial air carriers.
U.S. commercial airlines have experienced multiple consecutive years with very few fatalities, reflecting a shift toward mitigating human error and extreme weather risks in aviation.
Nearly half of aviation crashes occur during landing or takeoff, phases that are particularly challenging for flight crews.
Despite these risks, commercial air travel in the United States is considered one of the safest transportation modes overall.
The National Transportation Safety Board tracks U.S. commercial airline fatalities annually, providing comprehensive data that supports ongoing safety improvements.
Source: Bureau of Transportation Statistics and NTSB annual reviews.
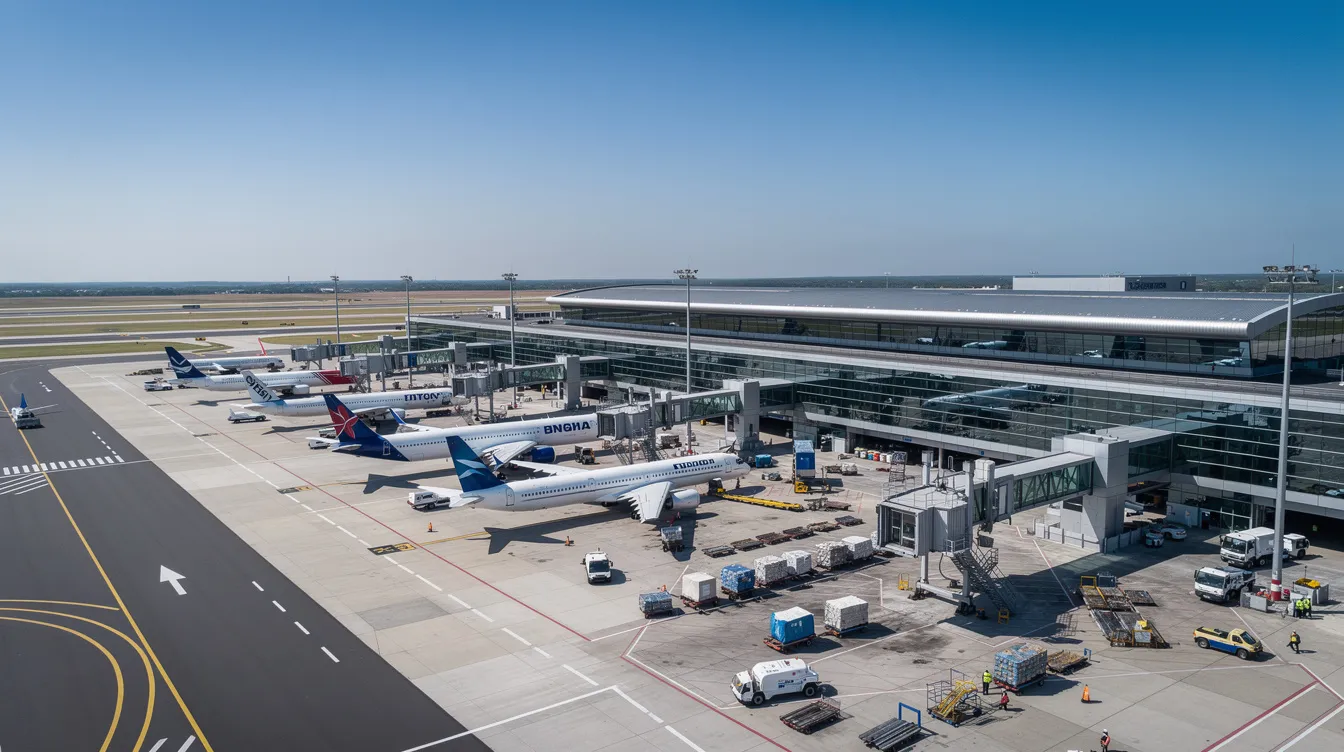
Certain years stand out in the record of U.S. commercial airline fatalities by year—either because catastrophic events happened or because they marked long stretches with zero deaths.
American Airlines Flight 191 crashed shortly after takeoff from Chicago O'Hare, killing 273. This made 1979 one of the deadliest years for U.S. airlines and prompted major maintenance and design reforms.
TWA Flight 800 exploded off Long Island, killing all 230 aboard. The incident drove fuel tank safety reforms that took years to implement.
A statistical outlier driven by the September 11 attacks and the separate crash of American Airlines Flight 587 in November, which killed 265 people. Combined, these events pushed the annual toll far beyond any recent year.
Colgan Air Flight 3407 crashed near Buffalo, New York, killing 50. This led to sweeping changes in regional airline pilot training and rest requirements.
Zero fatalities aboard U.S. scheduled carriers operating under Part 121. A milestone that would have been unthinkable 30 years earlier.
Continued the pattern of zero or near-zero fatal onboard deaths for scheduled large U.S. carriers.
Regulatory and technological changes followed many of these milestone years, contributing directly to lower fatalities in subsequent periods.
A handful of large-scale accidents dominate the fatality counts for certain years. When one plane carrying 200+ occupants goes down, it creates a visible spike in any chart of annual fatalities—even if every other flight that year operated safely.
American Airlines Flight 191 (1979)
On May 25, 1979, a DC-10 operated by American Airlines lost its left engine and wing slats during the takeoff roll at Chicago O'Hare. The aircraft crashed shortly after becoming airborne. All 271 passengers and crew aboard died, along with 2 people on the ground, for a total of 273 fatalities. This remains the deadliest single airplane accident in U.S. history. The accident resulted in a comprehensive review of DC-10 maintenance procedures.
TWA Flight 800 (1996)
On July 17, 1996, a Boeing 747 operated by TWA exploded shortly after takeoff from JFK Airport. The explosion killed all 230 people aboard. The NTSB determined that a fuel tank explosion was the cause, which led the FAA to mandate fuel tank inerting systems on commercial aircraft—a reform that took over a decade to fully implement.
American Airlines Flight 587 (2001)
On November 12, 2001, an Airbus A300 crashed shortly after departing JFK. The vertical stabilizer separated after excessive rudder input in response to wake turbulence from a preceding aircraft, placing extreme stress on the fuselage. All 260 people aboard and five people on the ground died—265 fatalities total. This aviation accident, happening just two months after September 11, compounded an already devastating year for U.S. aviation.
These rare but severe events heavily shaped yearly statistics and led to extensive NTSB investigations, driving safety upgrades that reduced the chance of similar incidents.
General aviation encompasses all non-military, non-scheduled civil flying. This includes private pilots, air taxis, corporate aircraft, and recreational flying in everything from a Cessna 172 to a turboprop, as well as professionally operated Part 135 charter companies.
Most modern civil aviation fatalities occur outside of major scheduled airlines.
General aviation aircraft are involved in 78% of crashes in the United States. This is a critical distinction, because many headline statistics about "aviation crashes" are driven by general aviation, even though public perception focuses on airline disasters.
Key differences:
General aviation's accident rate per flight hour is significantly higher than that of large commercial air carriers.
Smaller aircraft have fewer redundant systems, less experienced pilots (on average), and less regulatory oversight.
Air taxi and on-demand operators average roughly 20–25 fatalities per year, while scheduled Part 121 carriers often record zero.
Charter operators accessible through platforms like Jettly operate under stricter safety rules than most recreational general aviation, with crew training, maintenance standards, and operational control closer to airline levels, often flying some of the safest private jets in the world. For more on this, see Comprehensive Private Plane Safety Statistics and Insights.
The causes of fatal airplane accidents have shifted over time. Early decades were dominated by mechanical failure and structural problems. More recent incidents tend to involve human factors, severe turbulence, and weather-related events. Companies have moved to a model focusing on mitigating human error and extreme weather in aviation.
Engine failure or mechanical failure (more common in older aircraft)
Structural failures
Notable Accident:
PSA Flight 182 (1978): A Boeing 727 and a Cessna 172 aircraft collided over San Diego, killing 144 people. The collision led to sweeping airspace and air traffic control reforms, including mandatory Traffic Collision Avoidance Systems (TCAS).
Controlled flight into terrain (CFIT)
Runway excursions—where a plane overshot the runway or departed it during the takeoff roll
Pilot error and flight attendant or crew coordination failures
Notable Accident:
Delta Air Lines Flight 191 (1985): On August 2, 1985, a Lockheed L-1011 crash landed at Dallas/Fort Worth after encountering a microburst on final approach and hit a car before crash landing, killing 137 people. This accident was a contributing factor in the rapid development and deployment of wind-shear detection systems at airports and aboard aircraft.
Mid-air collision between aircraft
Severe weather, including microbursts and wind shear
Icing, thunderstorms, and low visibility
NTSB investigations convert these causes into concrete recommendations. Over time, this cycle of investigation and reform shows up as lower yearly fatality counts.
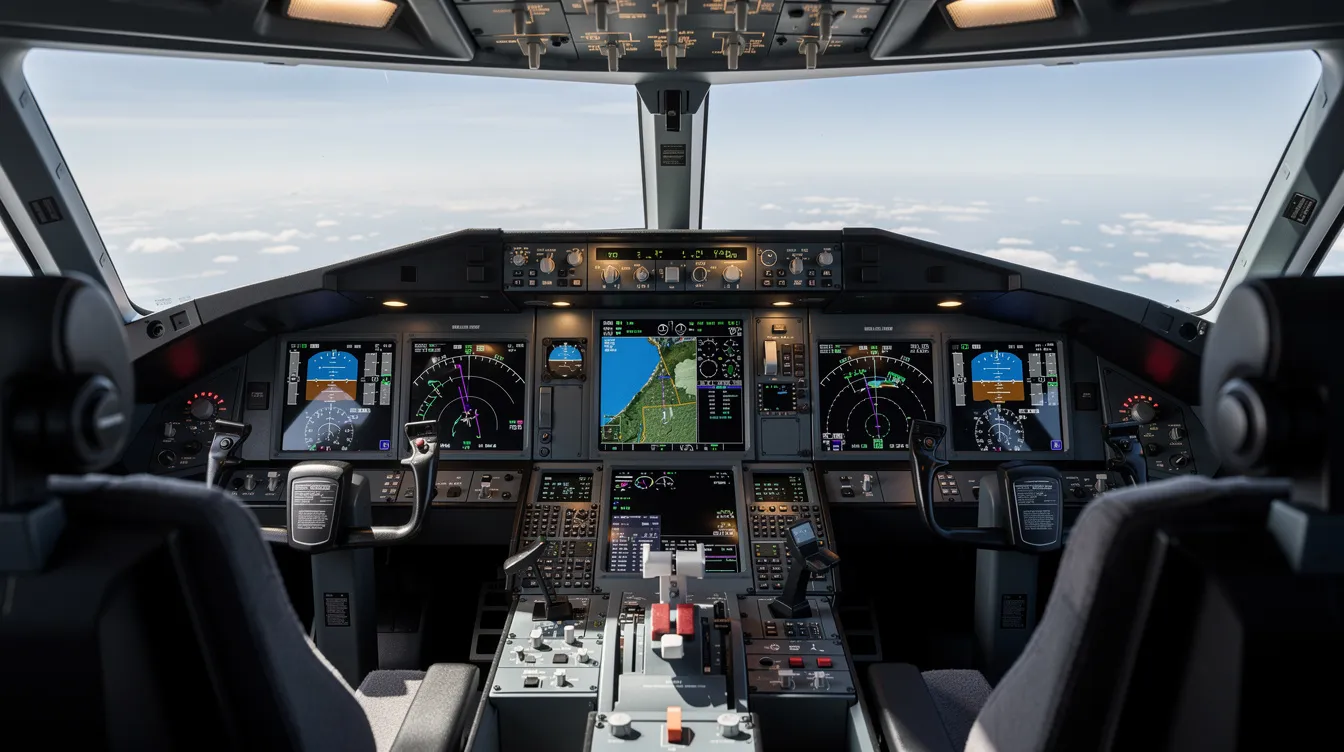
Flying with a U.S. commercial airline in the 1970s carried a measurably higher risk than it does today. Fatal accident rates per flight hour fell about 80% between 1983–2000 and 2001–2017. Current generations of commercial aircraft feature advanced safety technologies—fly-by-wire controls, redundant hydraulic and electrical systems, enhanced ground proximity warning systems—that have reduced accidents to historically low levels.
Air travel has 0.01 deaths per 100 million miles traveled, making commercial aviation in the United States one of the safest transportation modes by any measure.
Many years in the last decade recorded zero passenger fatalities on U.S. scheduled airlines—an outcome unthinkable in earlier eras.
Commercial air travel is considered incredibly safe overall when compared to driving, which has fatality rates many times higher per mile.
These improvements have also benefited business and charter aviation. Operators accessible through Jettly's platform benefit from the same technological advances and safety culture that drive airline safety, even as the global fleet of private jets has expanded significantly. For details on how private aviation safety compares, see Are Private Jets Safe? Exploring Safety Standards & Statistics.
Fatal accidents are not distributed evenly across all phases of flight. They cluster in specific conditions and flight phases.
Nearly half of aviation crashes occur during takeoff and landing—the phases when workload, speed changes, and proximity to the ground make recovery from errors or failures most difficult.
For U.S. commercial airlines, the most common fatal scenarios historically include:
Approach and landing accidents: Loss of control or CFIT during final approach, especially in poor weather conditions or low visibility.
Runway events: A plane overshot the runway during landing or experienced a rejected takeoff. Emergency landing situations also carry elevated risk.
Loss of control in flight: Structural failures, engine failure, or severe turbulence en route that overwhelmed the crew's ability to recover.
Fire or explosion: Events like the TWA 800 explosion are rare but devastating. Post-crash fire is also a factor when aircraft cannot escape the runway quickly and a fire truck must respond.
Environmental factors—icing, thunderstorms, microbursts, and low visibility—have historically contributed to fatal outcomes. Airlines invest heavily in weather radar, de-icing, and decision-support tools to mitigate these risks.
The FAA's regulatory framework, informed by NTSB recommendations, has been a primary driver of the declining fatality trend. Regulatory changes in the 1980s and 1990s improved aviation safety significantly.
Key reforms include:
Mandatory cockpit voice recorders and flight data recorders on all commercial aircraft
Stricter pilot duty and rest rules, especially after Colgan Air 3407 in 2009
Enhanced de-icing and icing certification standards following several icing-related accidents
Improved maintenance oversight and quality control programs
Fuel tank inerting initiatives after TWA Flight 800, designed to prevent fuel tank explosion
Traffic Collision Avoidance Systems (TCAS) mandated after mid-air collision incidents
A regulatory change in 1997 moved aircraft with 10 or more seats from Part 135 into Part 121. This shift slightly complicates direct comparison of pre- and post-1997 annual statistics, since it changed both the numerator (accidents counted) and the denominator (fleet size and departures).
While regulations alone did not eliminate fatal accidents, they contributed materially to the downward trend in fatalities by year. Each major accident prompted targeted reforms that addressed specific failure modes—whether it was a Boeing wing design issue, a training gap, or a weather-related vulnerability.
Understanding U.S. commercial airline fatalities by year helps travelers put aviation risk into honest perspective. A single high-profile airplane accident reported on the news can feel alarming, but long-term trends tell a far more reassuring story.
Practical guidance for interpreting the data:
Look at fatalities per million departures or per billion passenger-miles, not raw annual counts. These rate-based metrics account for the growth in air traffic volume.
Avoid overreacting to a single incident. One passenger injured or killed in a rare event does not change the overall safety trajectory.
Consider airline safety culture, maintenance practices, and regulatory oversight rather than raw accident counts when choosing how to fly.
For private jet charter decisions, travelers can review operator safety credentials and fleet standards before booking. Platforms like Jettly make this information accessible, allowing travelers to verify that their charter operator meets rigorous certification standards.
The world of large U.S. airlines is heavily consolidated and statistically well-tracked. Business and charter aviation is more fragmented, with thousands of operators flying different aircraft types across varying route structures.
However, properly regulated charter operators—including those Jettly works with—must meet certification standards similar in rigor to airline rules. This includes crew training requirements, maintenance intervals, and operational control procedures. The difference between professional charter operations and casual private flying is significant.
How private charter can enhance safety from a traveler's perspective, especially when using structured private jet memberships:
Avoiding tight connections and crowded hub airports reduces stress and missed-flight risk.
Choosing less congested airports and customizing departure times around weather improves schedule reliability.
Selecting specific aircraft types and operators based on safety records gives travelers more control, and comprehensive guides to charter airlines and private flight options can help inform those choices.
Secure air charter platforms vet operators and provide transparency into fleet maintenance and pilot qualifications, similar to how leading private jet charter companies emphasize safety culture and fleet standards.
For a closer look at how commercial flight compares to private flight, including time savings and flexibility, Jettly's resources break down the differences.
Year-by-year fatality data is more than a historical record. It shapes policy decisions, aircraft design, and traveler expectations.
Manufacturers use accident and incident data to redesign systems, enhance cockpit alerts, and improve structural safety margins. A wing failure or engines malfunction in one aircraft model leads to fleet-wide inspections and design changes, while travelers use similar data alongside affordable private jet booking strategies to balance cost, convenience, and risk.
Airlines and charter operators incorporate lessons learned into training, standard operating procedures, and route planning. If a ferry flight or cargo flight reveals a systemic issue, it feeds back into the safety loop, even for innovative models like crowdsourced private jet flights and shared empty seats.
Travelers can use an informed understanding of U.S. airline safety when choosing between scheduled commercial flights and private jet charter solutions like those offered through Jettly, using tools such as a private jet charter cost estimator to compare options.
The overall message is consistent: risk is low, but informed choices and robust oversight continue to push annual fatalities down.
U.S. commercial airline fatalities by year have dropped from hundreds annually in earlier decades to very low or zero in many recent years. In 2023, commercial aviation recorded the lowest fatalities ever, reinforcing that commercial aviation in the United States is one of the safest transportation modes available.
General aviation still accounts for most airplane accidents, while scheduled U.S. air carriers now have an exceptional safety record overseen by the NTSB and FAA.
Most modern civil aviation fatalities occur outside of major scheduled airlines.
Travelers today can confidently choose between commercial airlines and private jet charter, using safety data and operator oversight as key decision points.
Whether the priority is avoiding congestion at a busy airport, carrying specific cargo, or simply traveling on a personalized schedule, the safety foundation is strong across both commercial and well-regulated charter operations, including structured jet card programs that offer predictable access to aircraft.
Ready to experience private travel on your terms? Explore flight options or request a quote at Jettly.
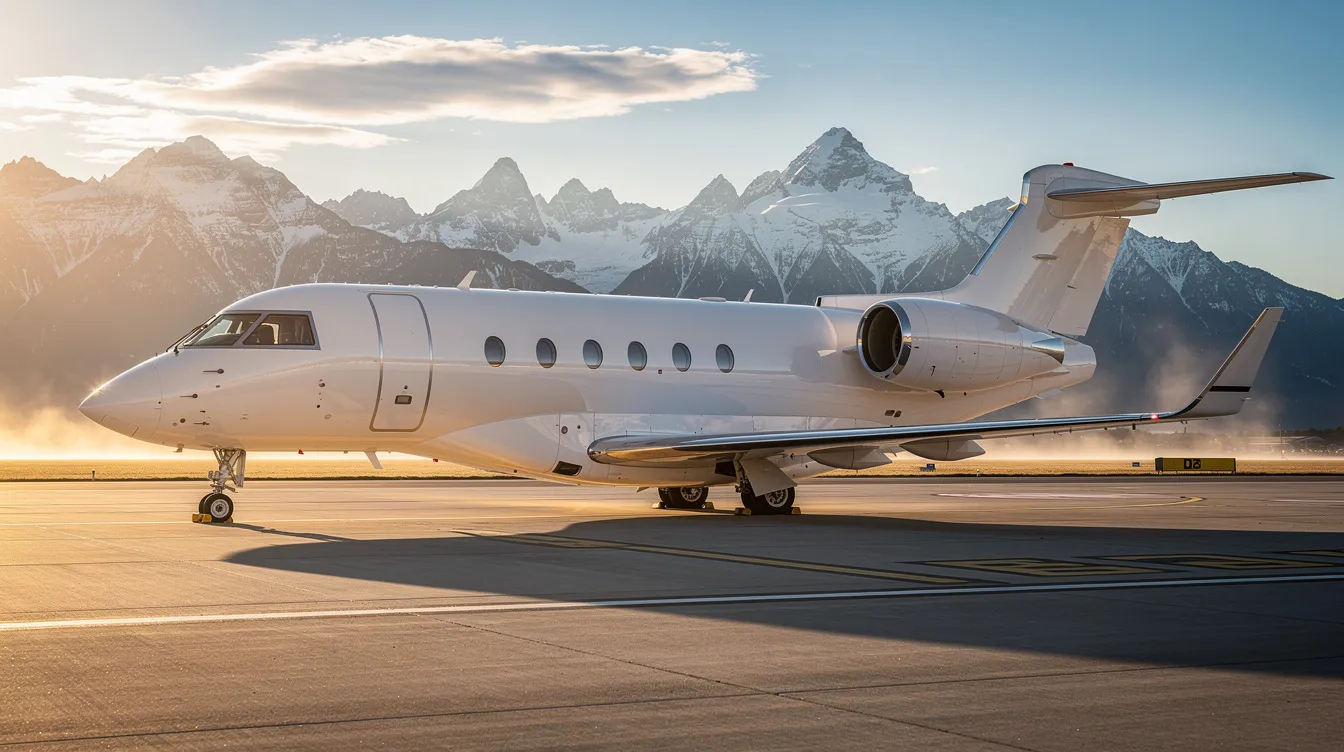
Fatalities peaked in the 1970s and 1980s, when multiple fatal accidents per year were routine and annual death tolls reached into the hundreds. Beginning in the 1990s, improved aircraft technology, stricter regulations, and better crew training drove a sustained decline. By the 2010s, several consecutive years passed with zero passenger deaths on major U.S. airlines operating under Part 121. The improvement is not just in raw numbers—fatality rates per departure and per passenger-mile have fallen even more dramatically because air traffic volume has grown substantially.
On a per-flight-hour or per-mile basis, large scheduled U.S. airlines are statistically much safer than general aviation. General aviation aircraft are involved in 78% of U.S. aviation crashes, despite accounting for a smaller share of total flight hours. This gap reflects differences in aircraft size, maintenance resources, pilot experience levels, and the depth of regulatory oversight. A struck bird or a minor engine failure that a commercial crew handles routinely could become a serious incident for an inexperienced private pilot.
Charter safety depends heavily on the operator's certification, maintenance standards, and crew training. Top-tier charter companies operate under rules closer to airline standards than to casual private flying. Travelers who use platforms like Jettly can access vetted operators, review safety credentials, and choose aircraft that meet their comfort and risk tolerance needs. For more, read Private Jet Safety: Why It's Safer Than You Think.
A single catastrophic accident can dominate the annual statistics. For example, TWA Flight 800 exploded on July 17, 1996, killing 230 people—an event that accounted for the vast majority of that year's scheduled airline fatalities. Similarly, 2001 saw both the September 11 attacks and the crash of American Airlines Flight 587, which together pushed the annual total far beyond any recent year. These spikes do not reflect a systemic change in safety; they reflect the outsized statistical impact of rare, high-casualty events.
The NTSB's online aviation accident database and annual safety reviews are the primary sources for official U.S. data. The FAA and the Bureau of Transportation Statistics also publish complementary data on flight activity—departures, flight hours, and passenger-miles—which helps put fatality counts into proper context. These resources are freely available and updated regularly.
The data on U.S. commercial airline fatalities by year highlights a profound transformation in aviation safety. From the high-fatality decades of the 1970s and 1980s to the record-low fatality rates seen in recent years, the trend clearly demonstrates that commercial air travel in the United States is safer than ever. Advances in technology, stringent regulatory oversight, and continuous improvements in pilot training and operational procedures have all contributed to this remarkable progress.
While rare catastrophic accidents have shaped safety reforms, they remain exceptions rather than the norm. The distinction between scheduled commercial airlines and general aviation is crucial, as most crashes occur in the latter. Travelers can confidently rely on the rigorous safety standards upheld by major carriers and vetted private charter operators like those accessible through Jettly.
For modern travelers, understanding these trends offers reassurance and empowers informed travel choices. Whether flying on a commercial airline or booking a private jet charter, safety remains a top priority backed by decades of data and continuous innovation, and tools like a jet card flight cost estimator help align budgets with safety and convenience needs.
Ready to experience private travel on your terms? Explore flight options or request a quote at https://www.jettly.com.
Share this post:
Jay Franco Serevilla
Sep 12, 2026
|
5
min read
Discover tips and trends in the industry.
5
min read
Fly AAA: How Jettly Simplifies Private Air Travel for AAA Members and Frequent Flyers
Jettly revolutionizes private air travel for AAA members by offering on-demand jet charters with transparent pricing and instant booking. This article compares traditional AAA commercial flights with Jettly's flexible private charter services, helping travelers choose the best option for their needs. Whether prioritizing cost or schedule control, understanding these choices enhances the travel experience.
Read More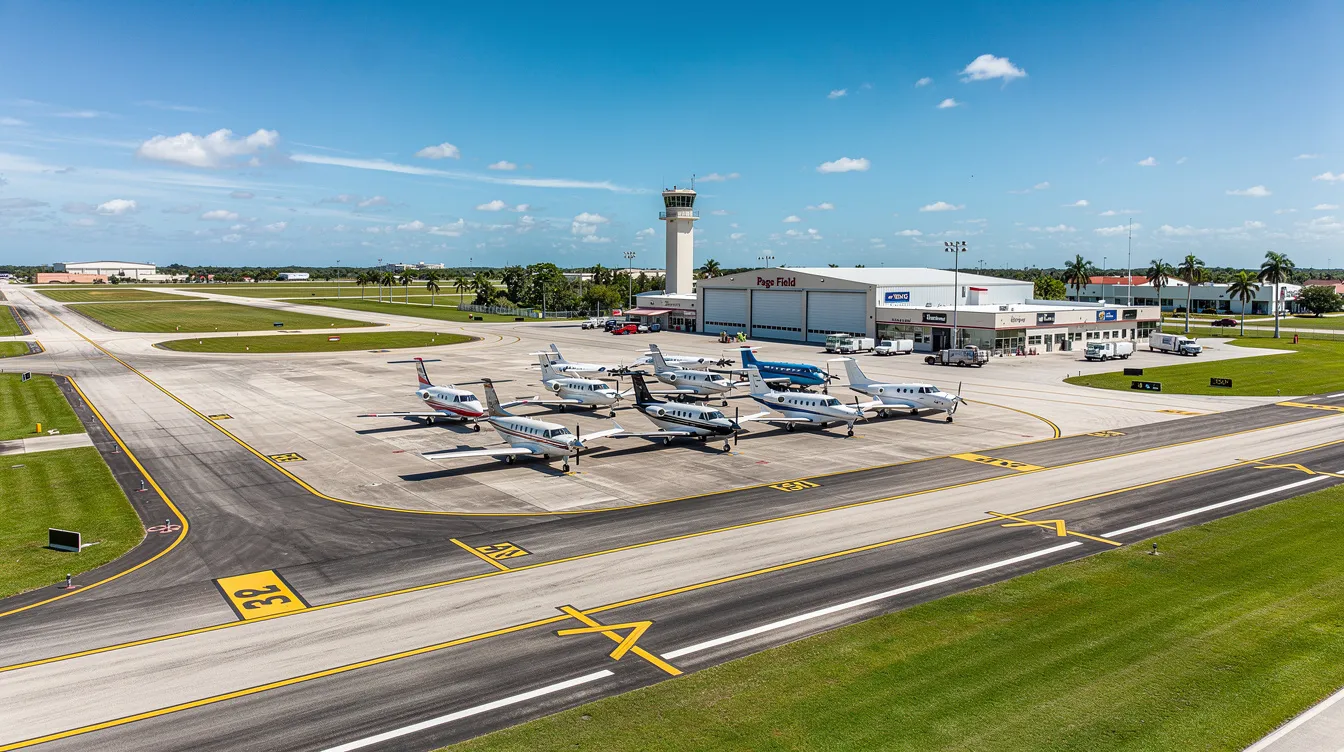
5
min read
Page Field Airport (FMY) in Fort Myers, FL: Complete Guide for General Aviation and Private Charter
Page Field Airport (FMY) in Fort Myers, FL, is a key general aviation hub, providing efficient access for private travelers and business aviation. With modern facilities, competitive fuel prices, and a range of charter options through Jettly, FMY is ideal for those seeking convenience and flexibility in their travel plans.
Read MoreStay updated with our latest insights and tips to elevate your journey with us.
MEMBERSHIPS AND ASSOCIATIONS



Disclaimer: Jettly operates as a charter broker, offering access to a global digital jet charter marketplace. Jettly is not a direct air carrier and does not own or operate aircraft. All advertised flights are conducted by third-party air carriers that are fully licensed and hold the appropriate Part 135 or Part 121 certifications issued by the Federal Aviation Administration (FAA) or equivalent regulatory authorities under U.S. or foreign law. Jettly complies fully with the U.S. Department of Transportation's Part 295 and Part 298 Charter Broker regulations. Jettly does not carry additional liability insurance. Passengers are covered by aircraft operator insurance. TICO: 50023770


