


Login
Get Instant Pricing On 23,000+ Aircraft

>

Airline safety statistics consistently show that air travel is among the safest forms of transportation. The global all-accident rate stands at 1.32 per million flights in 2025, and the fatal accident rate for air travel is roughly one per two billion miles flown.
In 2024, there were only four fatal airline accidents worldwide, and the average passenger fatality rate is one per 27 million passengers. The five-year average fatal accident rate from 2021 to 2025 is one for every 5.6 million flights.
Cars are 750 times more deadly per mile than commercial flights. By distance traveled, flying remains hundreds of times safer than driving.
Safety performance has improved steadily over decades. The average number of airline accidents has halved every 10 years, driven by better aircraft design, stronger regulation, and rigorous accident investigation.
Private jet charter through a regulated broker such as Jettly operates within the same civil aviation safety framework as scheduled airlines, with additional control over routing, schedules, and aircraft selection.
Statistics on airline safety show that flying is one of the safest ways to travel: the global all-accident rate was 1.32 per million flights in 2025, and the fatal accident rate is roughly one per two billion miles flown, making air travel hundreds of times safer than driving. For frequent flyers—corporate executives, high-net-worth individuals, families, and travelers weighing private jet charter—those numbers offer a practical baseline for judging risk, not just reassurance.
Aviation safety data shapes how regulators set standards, how airlines train pilots, and how passengers compare commercial service with private aviation, including major players such as NetJets and other leading private aviation providers. Organizations like ICAO, the International Air Transport Association, the Federal Aviation Administration, EASA, and the National Transportation Safety Board collect and publish safety statistics that track serious incidents across civil aviation.
The data is clear, but it is not one-dimensional. Regional safety differences, accident causes, technical hazards, aircraft design and survivability, the role of investigators and regulators, and emerging threats all affect how airline safety is measured and understood. This article breaks down those metrics and trends, compares air travel risk with other modes of transport, and explains how the same safety principles apply to private aviation through platforms like Jettly.
Safety risk across transportation modes is measured in several ways: deaths per billion journeys, per billion passenger-kilometers, or per billion passenger-hours. For comparing air travel to driving, distance-based metrics work best because flights cover far greater distances per trip.
Here is what the data shows:
The fatal accident rate for air travel is one per two billion miles.
Cars are 750 times more deadly per mile than commercial flights.
Air travel is one of the safest modes of transport, with commercial airlines in developed regions recording fewer than 0.07 deaths per billion passenger-miles.
|
Mode of Transport |
Deaths per Billion Passenger-Miles |
Relative Risk vs. Flying |
|---|---|---|
|
Commercial airline (scheduled) |
~0.07 |
Baseline |
|
Car / light truck |
~10–20 |
~150–750× higher |
|
Motorcycle |
~200+ |
~3,000× higher |
|
Bus/coach |
~0.4 |
~6× higher |
The average passenger fatality rate is one per 27 million passengers. In 2024, 238 passengers were killed in airline accidents across roughly 4.5 billion passenger journeys-a fatality risk that is vanishingly small by any statistical measure.
These comparisons apply primarily to large scheduled airlines and regulated air carrier operations. General aviation-personal flying, small unscheduled aircraft-carries a different risk profile and should not be conflated with commercial flight statistics, and platforms that position themselves as a NetJets alternative for flying private at lower cost still operate within the stricter commercial framework.
The accident rate per million flights is the standard metric used in airline safety statistics. A "flight" or "sector" counts as one takeoff to one landing. Not every accident is fatal; the term covers everything from serious ground damage to hull losses.
In 2025, the global picture looked like this:
The global all-accident rate stands at 1.32 per million flights.
IATA reported 51 total accidents across commercial aviation in 2025.
There were 8 fatal accidents reported in 2025, resulting in 394 fatalities.
Fatality risk increased in 2025 from 0.06 in 2024 to 0.17 per million sectors.
Regional variation remains significant. Here is a simplified comparison using recent IATA data:
|
Region |
Accident Rate per One Million Flights (approx.) |
|---|---|
|
Africa |
~10.6 |
|
Latin America & Caribbean |
~1.8 |
|
North America |
~1.2 |
|
Asia-Pacific |
~1.0 |
|
Europe |
~1.0 |
|
Global Average |
~1.3 |
These variations reflect differences in infrastructure, regulatory oversight, fleet age, and reporting quality. International efforts-including IATA's regional safety programs-continue to target higher-risk regions to enhance safety across the board.
The improvement in airline safety over the past twenty years-and the decades before them-is dramatic. In 1959, at the dawn of the Jet Age, the fatal accident rate for commercial jet airplanes exceeded 35 per million departures. By the late 1960s, it had dropped below 5. Today, it sits well under 1.
The fatal accident rate fell from 3.0 to 0.1 per million flights over recent decades. The average number of airline accidents has halved every 10 years. Passenger fatalities have halved every decade for 30 years.
Consider the contrast:
1980s–1990s: Global commercial aviation recorded an average of 20–30 fatal accidents per year, with far fewer total flights.
2020s: The industry now carries over 4 billion passengers annually, yet in 2024, there were four fatal accidents involving passengers. The five-year average fatal accident rate from 2021 to 2025 is one for every 5.6 million flights.
In 2024, there were four fatal airline accidents worldwide, and four accidents worldwide in total that year. In that same year, 238 passengers were killed-tragic, but statistically remarkable given the scale of global flight operations.
This downward trend is driven by improved aircraft design, better pilot training, more robust air traffic management, safety management systems, and lessons learned from every aviation accident investigation. It was a solid year for safety progress by nearly every metric, though 2025 saw a rise in fatalities that underscores the importance of continuous vigilance.

Understanding how airline safety metrics work helps put the numbers in context.
Accident rate per million flights/departures: The most common metric. A "sector" equals one flight leg.
Fatal accident rate: A subset counting only accidents that result in death.
Deaths per billion passenger-kilometers: Normalizes for distance, making cross-mode comparisons fair.
Accident vs. incident: ICAO defines an "accident" as an occurrence involving death, serious injuries, significant aircraft damage, or structural failure. An "incident" affects safety but falls short of those thresholds. Tracking near misses, serious incidents, and ground damage helps identify risk before crashes occur.
Data sources include ICAO safety databases, IATA annual reports, NTSB civil aviation statistics, and Boeing's Statistical Summary. Improvements in reporting can initially make safety statistics look worse-more minor events are classified and counted-even as actual safety improves.
Private jet operators and charter brokers like Jettly rely on similar metrics and safety reports when screening operators. For more detail, see Jettly's overview of private plane safety statistics.
The airline industry is not monolithic. Risk levels vary by region, operator type, and operation-scheduled airlines versus charter versus general aviation.
Large, regulated commercial airlines in North America, Europe, and much of Asia-Pacific maintain extremely low accident rates. Smaller regional airlines or loosely regulated carriers in some developing markets face higher risk due to weaker oversight, older fleets, and limited infrastructure.
Key factors behind regional differences:
Regulatory oversight: Strong national authorities correlate with lower accident rates.
Fleet type: Turboprop aircraft have a higher accident rate compared to jets, at 4.08 versus 1.03 per million flights.
Audit programs: Airlines registered under IOSA maintain lower accident rates compared to non-IOSA operators. In 2025, IOSA-audited carriers recorded an accident rate of 0.98 per million flights.
Infrastructure: Radar coverage, GNSS availability, airport design, and runway conditions all play a critical role.
Between 1990 and 2015, there were 1,874 commuter accidents in the U.S.-a figure that highlights how smaller operations carry proportionally higher risk than major air carrier operations, which is why many travelers focus on choosing the safest private jet models and operators when they opt for business aviation.
In the private jet charter world, platforms like Jettly mitigate variability by working only with licensed operators meeting specific civil aviation authority standards and third-party safety audits.
Aviation accident investigations consistently point to several categories of contributing factors:
Human factors: Pilot error accounts for 33% to 60% of aviation accidents. This includes manual handling errors, loss of situational awareness, and non-compliance with standard operating procedures.
Mechanical or system failure: Aircraft malfunction contributes to roughly 22% of accidents.
Weather conditions: Adverse weather-thunderstorms, icing, poor visibility-plays a role in about 22% of accidents occurred globally.
Operational/organizational factors: Insufficient safety culture, training gaps, and latent conditions round out the picture.
Historical examples illustrate how causes have shifted:
Controlled flight into terrain was once a leading killer. TAWS (terrain awareness and warning systems) has sharply reduced CFIT events.
Runway excursions remain among the more frequent accident types. In 2005, Southwest Airlines Flight 1248 slid off a runway in snow at Chicago Midway-a reminder that weather and operational decisions intersect.
Loss of control in-flight accidents were absent from the accident record for 2025, marking a notable improvement in that category.
Modern safety management systems, standardized procedures, and automation address these causes. Every serious incident feeds into global safety databases used by regulators and operators-including private charter operators-to update training and procedures.
Beyond human and mechanical factors, commercial aircraft face a range of environmental and technical hazards:
Foreign object debris (FOD): Runway debris can cause tire failure or engine damage. The 2000 Air France Flight 4590 Concorde crash, caused by a metal strip on the runway, remains a stark example. Modern airports deploy FOD detection systems and regular sweeps to enhance safety.
Bird strikes: Engines are certified to survive ingestion of birds within defined weight limits. Airports manage wildlife hazards through habitat modification and monitoring.
Wind shear and microbursts: These weather phenomena contributed to dozens of major U.S. crashes between 1964 and 1985. Onboard and ground-based detection systems have since reduced wind shear incidents dramatically.
GNSS interference: GNSS interference incidents rose by 193% from 2023 to 2025. Jamming and GPS spoofing-particularly over conflict zones-present a growing hazard. Aircraft rely on redundant navigation systems (inertial, radio-based) as backup.
These hazards are actively monitored by the Commercial Aviation Safety Team and similar organizations. Flight crew training now covers recognition and response to each of these scenarios as standard, and operators offering private charter aircraft across multiple categories incorporate these threat scenarios into their procedures and simulator programs.
Modern commercial aircraft and airplanes are engineered not only to prevent accidents but to make survivable accidents more survivable.
Structural improvements include fatigue-resistant alloys and composite materials, rigorous nondestructive testing, and fail-safe design principles. Historical structural failures-like the Comet-era fuselage fatigue cracks-led to inspection and maintenance protocols that remain in force across civil aviation today.
Cabin safety features include:
Fire-resistant seat fabrics and insulation that add 40–60 seconds of survivable evacuation time during post-crash fires.
Improved seat strength standards and seatbelt design.
Wings and engines designed to shear off in a collision to absorb energy and protect passengers.
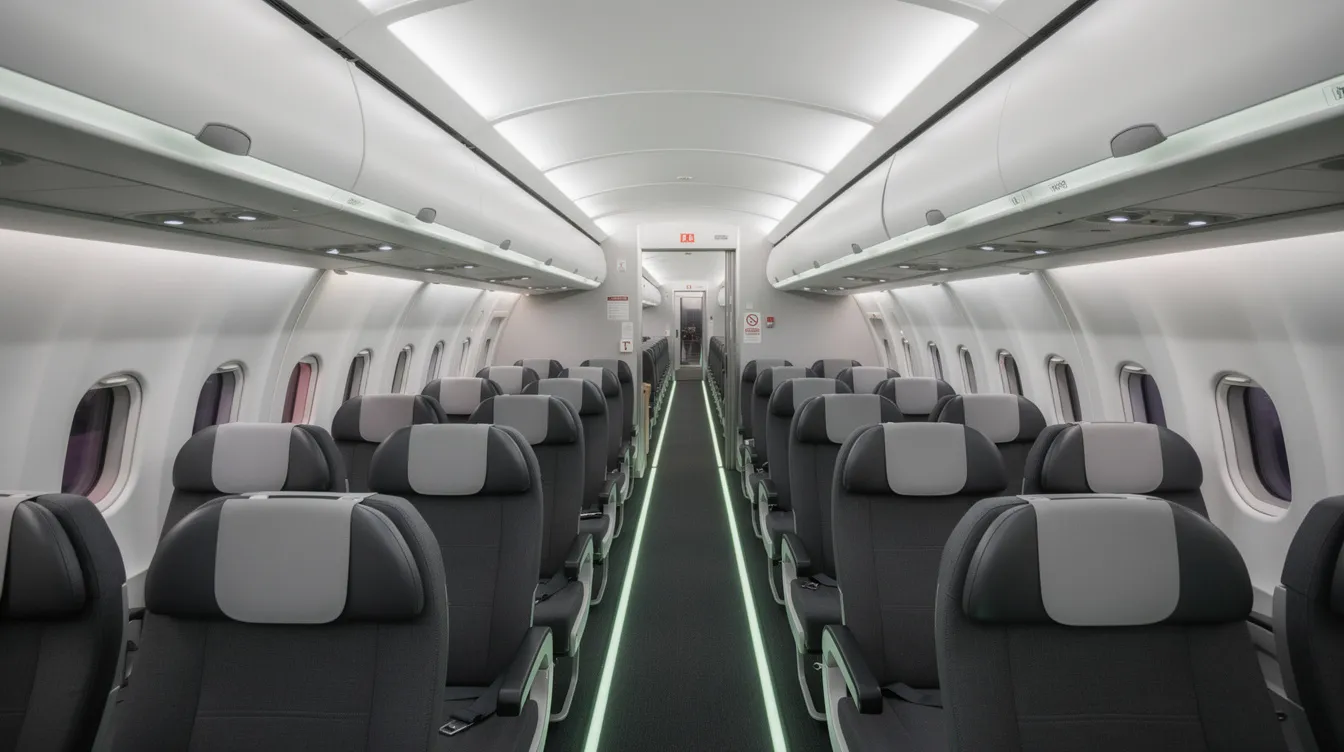
Emergency exit placement, floor-path lighting, and smoke detection systems.
The Federal Aviation Administration requires a 90-second evacuation demonstration with half the exits blocked before certifying any new aircraft. In many commercial airline accidents, the majority of passengers survive; crashes are rarely 100% fatal. Flight attendants play a critical role in managing these evacuations effectively.
National investigation organizations such as the National Transportation Safety Board in the U.S. and the Transportation Safety Board of Canada operate with statutory independence. Their mandate: determine probable cause, not assign blame. Investigators specialize in flight operations, human factors, aircraft structures, engines, air traffic control, and flight data recorders.
Their findings feed directly into global safety improvement. However, the process is not always fast. Accident investigation reports are delayed 37% of the time globally. Accident investigation completion rates vary regionally, with CIS at 81%-a figure that highlights the importance of institutional capacity.
Regulatory authorities require airlines to implement robust Safety Management Systems to manage operational hazards. The FAA, EASA, and Transport Canada set and enforce standards covering aircraft certification, pilot licensing, maintenance, and security.
Collaborative initiatives like the Commercial Aviation Safety Team, ASIAS (Aviation Safety Information Analysis and Sharing), and ICAO's Universal Safety Oversight Audit Programme drive proactive risk management through data sharing and board-level oversight.
Reputable charter brokers like Jettly operate within this framework by partnering only with operators holding valid Air Operator Certificates and robust safety management systems. Learn more about how Part 135 charter companies meet these requirements.
Flying through or near conflict zones increases operational complexity. Military activity and the potential misidentification of civil aircraft present real risk-as demonstrated by incidents in which civilian planes were downed in recent years (excluded from standard airline accident classifications by IATA).
Under the Chicago Convention, states are expected to restrict or close dangerous airspace, issue clear NOTAMs, and coordinate between military and civil authorities. Timely, transparent risk advisories from governments and international organizations help airlines and business aviation operators adjust routes accordingly.
Emerging non-military threats add new layers of complexity:
Cyber risks: Growing digital integration in flight operations creates potential vulnerabilities.
GNSS interference: As noted, interference incidents have surged since 2023.
Drone incursions: Unauthorized drones near airports and in controlled airspace are increasingly tracked and mitigated.
Both airlines and private jet operators adjust flight plans, altitudes, or routings to avoid high-risk areas. Platforms like Jettly rely on operator risk assessments and official guidance when arranging flights that might be affected by terrorism-related threats or active conflict, whether for regional missions or longer international private jet routes such as private jet charter services in Kolkata and West Bengal.
Scheduled airlines and private aviation-including business jets, air taxis, and charter flights-both operate under civil aviation safety regulations. The distinction matters when interpreting safety statistics.
General aviation (recreational, personal flying) shows higher accident rates per flight hour than major airlines. But professionally flown, turbine-powered business jets operating under commercial regulations have significantly better safety records than small personal aircraft. Major safety-rating watchdogs evaluate airlines and operators based on serious incidents, pilot training, maintenance history, and operational standards, even for innovative models like crowdsourced private jet flights and shared empty seats.
A charter marketplace like Jettly enhances safety for its customers by offering structured private jet membership programs with vetted operators and by:
Working only with certified air carriers holding valid operating certificates and providing access to structured jet card programs with consistent aircraft and crews.
Verifying operator credentials and monitoring safety performance databases.
Favoring operators with strong safety ratings from ARGUS, Wyvern, or IS-BAO while helping clients choose between shared charter flights and full private charters based on their risk tolerance and privacy needs.
Providing access to pilots with documented qualifications and recurrent training, alongside tools like a private jet charter cost estimator that clarifies how safety, crew experience, and aircraft type influence pricing.
Private jet travel can also enhance safety for certain trips through direct routing that avoids multiple connections, access to less congested airports, and the ability to adjust departure times around forecast severe weather conditions, especially when using tools like Jettly's airport locator for private flights to select suitable departure and arrival fields.
While no form of transportation is risk-free, regulated private jet charter through platforms such as Jettly sits inside the same robust civil aviation safety ecosystem that has made modern air travel extraordinarily safe. Travelers comparing operators can consult broader guides to the best private jet charter companies and safety-focused providers. For a deeper look, read Jettly's guide on private jet safety.
Understanding airline safety data does not require a degree in statistics. Here are practical steps, especially relevant for those flying with children or older relatives and weighing the best private planes for families prioritizing comfort and care:
Focus on long-term trends: Declining accident rates per million flights and decreasing fatality risk over the past twenty years matter more than isolated high-profile incidents that dominate news cycles.
Check certification: Confirm that an airline or operator holds appropriate certification and has no recent pattern of serious enforcement actions.
Look at industry programs: Membership in safety programs like IOSA and completion of independent audits signal higher safety performance.
For private jet travelers: Ask about operator safety ratings, crew qualifications, maintenance schedules, and whether the operator runs a formal safety management system. Platforms like Jettly make this easier by pre-screening every operator and offering practical guidance on how to get a seat on a private jet affordably.
Put numbers in perspective: Comparing the risk of flying to the risk of driving-or even everyday activities-helps translate abstract transportation statistics into intuitive understanding, especially when weighing those risks against the financial side using resources that explain how much a private jet really costs.
Understanding basic airline safety statistics can reduce fear of flying and help travelers choose carriers and services aligned with their risk tolerance and preferences.
Various industry reports estimate the chance of a person dying in a commercial airline crash at roughly one in 10–30 million boardings. In 2024, the passenger fatality rate was one per 27 million passengers. This risk has fallen more than tenfold since the 1980s and 1990s, even as global passenger numbers have grown to over 4 billion per year. For the average traveler, a commercial flight remains one of the least risky transportation choices available-far safer per mile than driving a car. Those considering private alternatives can apply the same risk perspective while learning what drives the cost of a single private jet flight.
While all scheduled carriers must meet minimum civil aviation authority standards to operate, safety performance can vary. Differences often relate to fleet age, safety culture, maintenance quality, and the robustness of the oversight regime in the airline's home country. Rather than judging on a single crash or headline, travelers should look at long-term safety records, independent safety ratings, and membership in programs like IOSA. Airlines participating in these audit programs consistently show lower accident rates.
Professionally flown business jets operating under commercial rules (such as Part 135 regulations) have strong safety records-generally much better than small personal aircraft in general aviation. However, their per-hour risk may not always match that of large scheduled airlines. Safety depends heavily on the operator's standards, crew training, and maintenance practices, and understanding the broader landscape of charter airlines and private flight providers helps travelers evaluate those differences. Charter marketplaces like Jettly help customers access operators with solid safety credentials and audited safety programs, reducing variability and enhancing overall safety.
Controlled flight into terrain (CFIT) occurs when an airworthy aircraft, under pilot control, unintentionally flies into the ground, water, or an obstacle. CFIT was once one of the leading causes of fatal airline accidents, especially in poor visibility and mountainous terrain. The introduction of terrain awareness and warning systems (TAWS), better approach procedures, and satellite navigation has sharply reduced CFIT incidents over the last two decades. It is no longer the dominant accident type it once was.
Nervous passengers should focus on long-term figures showing continuous improvement rather than recent headlines. Translating abstract statistics into intuitive comparisons helps: for example, a person would need to fly every day for thousands of years to statistically encounter a fatal accident. Anxious travelers considering private charters can ask their broker or operator specific questions about safety practices, which can provide a sense of control and reassurance, and may also benefit from guides on choosing the best cross-country aircraft for their journeys to match comfort and safety needs. Learning how the industry investigates and learns from every incident can also build confidence in the system.
Airline safety statistics tell a clear story: modern commercial aviation has reached an unprecedented level of safety. Accident rates have fallen substantially over decades due to improved safety systems and regulations. The fatal accident rate fell from 3.0 to 0.1 per million flights. In 2024, there were four fatal airline accidents across billions of passenger trips-a data point that would have seemed impossible just a generation ago.
Ongoing efforts in technology-satellite navigation, terrain awareness, wind shear detection-along with stronger regulation, independent investigation, and global data sharing continue to drive improvement. Both airline passengers and private jet travelers benefit from a mature civil aviation safety framework designed to anticipate and manage risk rather than simply react to crashes after they happen.
The importance of continued investment in safety cannot be overstated. Whether flying commercially or chartering privately, travelers are carried by an industry that treats every incident, every near miss, and every report as an opportunity for improvement.
Ready to experience private travel on your terms? Explore flight options or request a quote at https://www.jettly.com, or review Jettly's overview of affordable private jet charter pricing to understand how budget and safety considerations align.
Share this post:
Jay Franco Serevilla
Sep 15, 2026
|
5
min read
Discover tips and trends in the industry.

5
min read
Private Jet from Dallas to Las Vegas: 2026 Guide to Flight Time, Costs, and Best Jets
Chartering a private jet from Dallas to Las Vegas offers a swift and luxurious travel experience, averaging 2 hours and 10 minutes for the journey. With costs ranging from $13,000 to over $34,000 depending on the aircraft type, travelers can choose from a variety of jets to suit their needs. This guide provides insights into flight times, costs, and tips for optimizing your private jet experience.
Read More
5
min read
Top 10 Cheapest Private Jets in 2026: Ownership, Operating Costs, and Smarter Alternatives
Discover the top 10 cheapest private jets of 2026, focusing on ownership costs, operating expenses, and smarter charter alternatives. This guide highlights very light jets and turboprops that offer budget-friendly options for travelers, emphasizing the financial benefits of chartering through platforms like Jettly for those flying under 200 hours annually.
Read MoreStay updated with our latest insights and tips to elevate your journey with us.
MEMBERSHIPS AND ASSOCIATIONS



Disclaimer: Jettly operates as a charter broker, offering access to a global digital jet charter marketplace. Jettly is not a direct air carrier and does not own or operate aircraft. All advertised flights are conducted by third-party air carriers that are fully licensed and hold the appropriate Part 135 or Part 121 certifications issued by the Federal Aviation Administration (FAA) or equivalent regulatory authorities under U.S. or foreign law. Jettly complies fully with the U.S. Department of Transportation's Part 295 and Part 298 Charter Broker regulations. Jettly does not carry additional liability insurance. Passengers are covered by aircraft operator insurance. TICO: 50023770


