


Login
Get Instant Pricing On 23,000+ Aircraft

>
For years, anybody managing a corporate flight department or a family office likely assumed aviation would get more expensive—fast. But in 2025, that trend hit a wall.
According to data cited by Forbes, private jet charter and jet card rates grew by just 1.7% year-over-year. Compare that to the U.S. Consumer Price Index (CPI), which jumped 2.7% in the same window. It’s a rare decoupling. For the first time in the post-pandemic era, flying private is actually lagging behind the national inflation rate, rather than driving it.
This one-percentage-point gap isn’t just a rounding error; it’s a structural pivot. We’re seeing a market where the old “premium” pricing power is cooling off as supply finally stabilizes. Tight capacity and aging fleets aren’t pushing rates skyward the way they used to. For decision-makers, this is the signal they’ve been waiting for: Aviation inflation is no longer outstripping the rest of the economy. As this article from private jet charter broker Jettly reveals, it’s a moment of normalization that changes the math for the entire sector.
The current stabilization follows a period of extreme fiscal volatility. As Forbes mentions in its report from 2019 to 2023, private jet charter rates climbed nearly 27%, creating a structural budgeting challenge for long-term operators. Even as flight activity began to plateau, a combination of constrained supply and maintenance bottlenecks kept hourly rates elevated well into 2024. This trend forced many organizations to rethink their approach to aviation asset management.
Organizations began modeling aviation spend as a volatile commodity rather than a standard procurement cost. This shift reflects a move toward prioritizing capital liquidity, treating flight hours as an operating expense (OpEx) that requires active risk hedging.
By late 2024, macroeconomic forces finally began to temper the industry’s pricing power, leading to the 1.7% growth rate observed in 2025. This normalization provides a rare window of predictability for travel departments that were previously struggling with double-digit annual increases.
Demand normalization is the primary factor behind this trend. Private jet utilization in North America experienced a steady contraction through mid-2025, particularly within the light and mid-size aircraft categories. This reduction in flight volume reduced the immediate pressure on hourly rates during non-peak travel periods, forcing operators to adjust their pricing models to maintain fleet utilization.
Data from the Business Times Journal confirm the trend, with Q3 2025 hourly rates slipping 0.1%—marking the first quarterly decrease since 2019. While a 0.1% decline may sound modest, directionality matters.
After five years of continuous, aggressive increases, even a flatline in pricing signals a material shift in market dynamics. This cooling is largely attributed to the stabilization of the “entry-level” private travel segment, which saw the most significant surge in new users during the early 2020s.
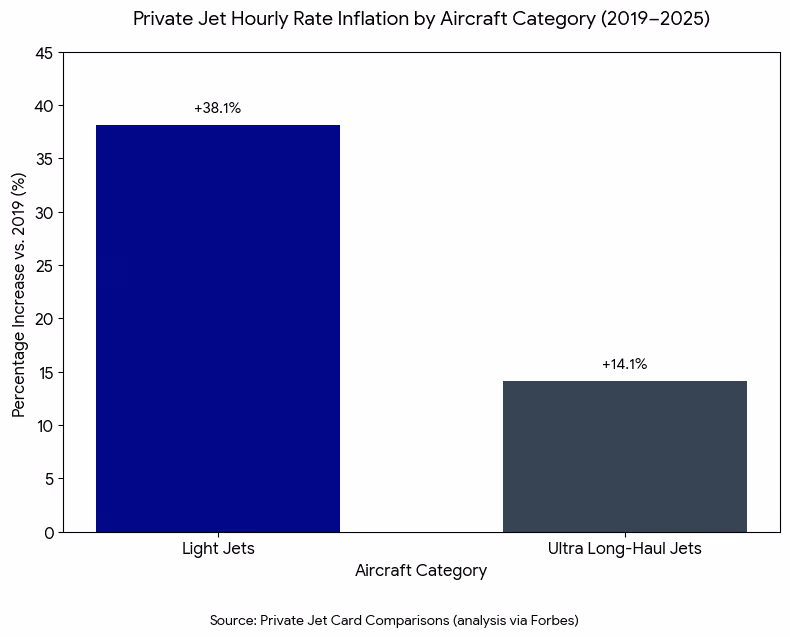
Category-specific pricing shifts reveal how uneven the past six years have been for operators and travelers. Industry data shows that light jets experienced the strongest inflation, with hourly rates increasing 38.1% between 2019 and 2025.
This bifurcation highlights a structural reality in the market: Inflation has been highest on aircraft types used for the highest-frequency, sub-3-hour missions. Light jets, which tend to be favored for corporate shuttles, bear the brunt of regional pilot shortages and high cycles-per-hour utilization.
Conversely, ultra long-haul jets rose just 14.1% over the same period, reflecting deeper fleet availability in the large-cabin category and more stable demand profiles for intercontinental missions. Large-cabin aircraft benefit from longer mission durations and more disciplined supply growth, all of which helped insulate them from the steeper inflation seen in lighter segments.
During the 2019–2023 surge, private aviation inflation was running roughly 2x–3x faster than CPI. The reversal in 2025 suggests normalized market mechanics:
Put simply, charter is no longer in an inflation‑supercycle, and rate stabilization is real.
Given the 2025 reset, organizations are rethinking how to structure their private aviation strategies.
Three shifts stand out.
As 2026 rolls on, most indicators point to continued stability. Fleet utilization is projected to remain below 2022 peaks, new aircraft deliveries are increasing—particularly in the mid-size segment—and operators are prioritizing predictable pricing to retain high-value corporate clients.
The wild card remains macroeconomic volatility. A sharp rise in fuel costs or a demand spike could reintroduce rate pressure. But absent structural shocks, the market is positioned for the first stable pricing environment in nearly six years.
For C-suite leaders and HNWIs, the takeaway is operational rather than emotional, as private aviation is a manageable line item again, as opposed to an inflation outlier.
Share this post:
Jay Franco Serevilla
Feb 22, 2026
|
5
min read
Discover tips and trends in the industry.
5
min read
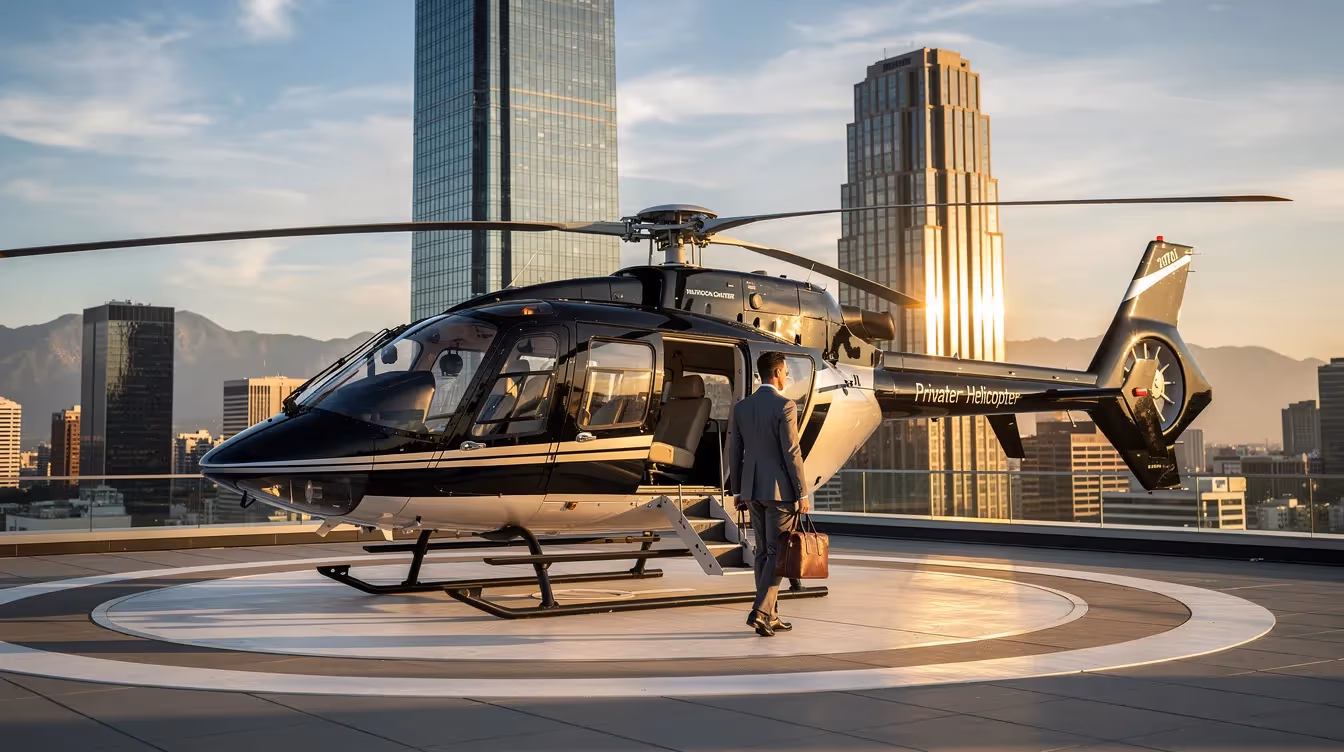
Helicopters: History, Technology, and How They Power Modern Private Travel
Helicopters provide unique advantages in aviation, such as vertical takeoff and landing, allowing access to locations without runways, which is essential for private travel to constrained destinations. They have evolved from early concepts to modern machines capable of various missions, including medical evacuation, search and rescue, and VIP transport. Jettly offers helicopter charter services that complement private jet travel, enabling seamless point-to-point transfers and direct access to remote locations. The choice between helicopters and fixed-wing aircraft depends on factors like distance, landing options, and passenger needs, with Jettly's platform facilitating easy comparisons and bookings.
Read More
5
min read
CheapOair Alternatives: Smarter Flight Deals and Private Jet Options with Jettly
CheapOair is a popular online travel agency that offers budget-friendly flight, hotel, and car rental options but often faces criticism for hidden fees and customer service issues. In contrast, Jettly provides a private jet charter marketplace with transparent pricing, dedicated support, and access to over 20,000 aircraft, catering to travelers who prioritize time, flexibility, and privacy over the lowest fare. While CheapOair is suitable for budget-conscious solo travelers with straightforward itineraries, Jettly is ideal for groups or urgent travel needs, offering a more personalized and efficient travel experience. Ultimately, the choice between the two depends on individual preferences for cost versus convenience and service quality.
Read MoreStay updated with our latest insights and tips to elevate your journey with us.
MEMBERSHIPS AND ASSOCIATIONS


Disclaimer: Jettly operates as a charter broker, offering access to a global digital jet charter marketplace. Jettly is not a direct air carrier and does not own or operate aircraft. All advertised flights are conducted by third-party air carriers that are fully licensed and hold the appropriate Part 135 or Part 121 certifications issued by the Federal Aviation Administration (FAA) or equivalent regulatory authorities under U.S. or foreign law. Jettly complies fully with the U.S. Department of Transportation's Part 295 and Part 298 Charter Broker regulations. Jettly does not carry additional liability insurance. Passengers are covered by aircraft operator insurance. TICO: 50023770


